Good news, seems even with the rain we received this week the lake level has started to go down a bit.
Friday June 21st, the average level is at 75.95 M (249.18 Feet)
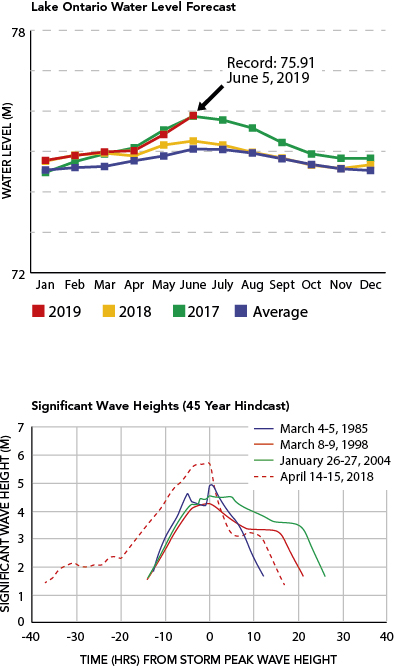
Per Fisheries and Oceans Canada, Since 2008, the June lake level average has been 75.16 M
The average lake level for June 2017 was 75.81 M
Surface water temperature by the lift bridge is 9C / 48 F
Next reading date is: Friday June 28th, 2019
Reading date / Lake Average 2019
June 14 – 75.984
June 07 – 75.97
May 30 – 75.94
May 24 – 75.86
May 17 – 75.795
May 03 – 75.51
Apr 29 – 75.41
Apr 12 – 75.10
Mar 29 – 75.018
Mar 15 – 75.0
Mar 08 – 74.97
Feb 22 – 75.00
Feb 08 – 74.96
Jan 25 – 74.88
Jan 11 – 74.81
++++++++++++++++++++++++++++++++++++++++++++++
Reading date / Lake Average 2018
Dec 28 – 74.78
Dec 14 – 74.72
Nov 30 – 74.696
Nov 16 – 74.68
Nov 02 – 74.67
Oct 19 – 74.614
Oct 05 – 74.72
Sept 21 – 74.785
Sept 07 – 74.86
Aug 24 – 74.91
Aug 10 – 74.98
Jul 30 – 75.12
Jul 13 – 75.129
Jun 29 – 75.228
Jun 15 – 75.25
Jun 01 – 75.33
May 18 – 75.35
May 04 – 75.23
Apr 20 – 75.08
Apr 06 – 74.97
Mar 23 – 74.918
Mar 09 – 74.99
Feb 23 – 74.973
Feb 09 – 74.90
Jan 26 – 74.95
Jan 12 – 74.81 M
++++++++++++++++++++++++++++++++++++++++++++++++
Reading date / Lake Average 2017
Dec 27 – 74.71 M
Dec 08 – 74.795
Nov 24 – 74.89
Nov 09 – 74.929
Oct 27 – 74.83
Oct 10 – 74.95
Sept 29 – 74.99
Sept 15 – 75.12
Sept 01 – 75.28
Aug 18 - 75.47
Aug 04 - 75.6
July 22 - 75.71
Updated forecast for 2019 & Experimental 5 year forecast from the Army Corps of Engineers.


Friday June 21st, the average level is at 75.95 M (249.18 Feet)
Per Fisheries and Oceans Canada, Since 2008, the June lake level average has been 75.16 M
The average lake level for June 2017 was 75.81 M
Surface water temperature by the lift bridge is 9C / 48 F
Next reading date is: Friday June 28th, 2019
Reading date / Lake Average 2019
June 14 – 75.984
June 07 – 75.97
May 30 – 75.94
May 24 – 75.86
May 17 – 75.795
May 03 – 75.51
Apr 29 – 75.41
Apr 12 – 75.10
Mar 29 – 75.018
Mar 15 – 75.0
Mar 08 – 74.97
Feb 22 – 75.00
Feb 08 – 74.96
Jan 25 – 74.88
Jan 11 – 74.81
++++++++++++++++++++++++++++++++++++++++++++++
Reading date / Lake Average 2018
Dec 28 – 74.78
Dec 14 – 74.72
Nov 30 – 74.696
Nov 16 – 74.68
Nov 02 – 74.67
Oct 19 – 74.614
Oct 05 – 74.72
Sept 21 – 74.785
Sept 07 – 74.86
Aug 24 – 74.91
Aug 10 – 74.98
Jul 30 – 75.12
Jul 13 – 75.129
Jun 29 – 75.228
Jun 15 – 75.25
Jun 01 – 75.33
May 18 – 75.35
May 04 – 75.23
Apr 20 – 75.08
Apr 06 – 74.97
Mar 23 – 74.918
Mar 09 – 74.99
Feb 23 – 74.973
Feb 09 – 74.90
Jan 26 – 74.95
Jan 12 – 74.81 M
++++++++++++++++++++++++++++++++++++++++++++++++
Reading date / Lake Average 2017
Dec 27 – 74.71 M
Dec 08 – 74.795
Nov 24 – 74.89
Nov 09 – 74.929
Oct 27 – 74.83
Oct 10 – 74.95
Sept 29 – 74.99
Sept 15 – 75.12
Sept 01 – 75.28
Aug 18 - 75.47
Aug 04 - 75.6
July 22 - 75.71
Updated forecast for 2019 & Experimental 5 year forecast from the Army Corps of Engineers.
Likes:
scotto